Layout
The 2D graph layout can use a selection of layout algorithms to achieve different visual results, in some cases having very different running times.
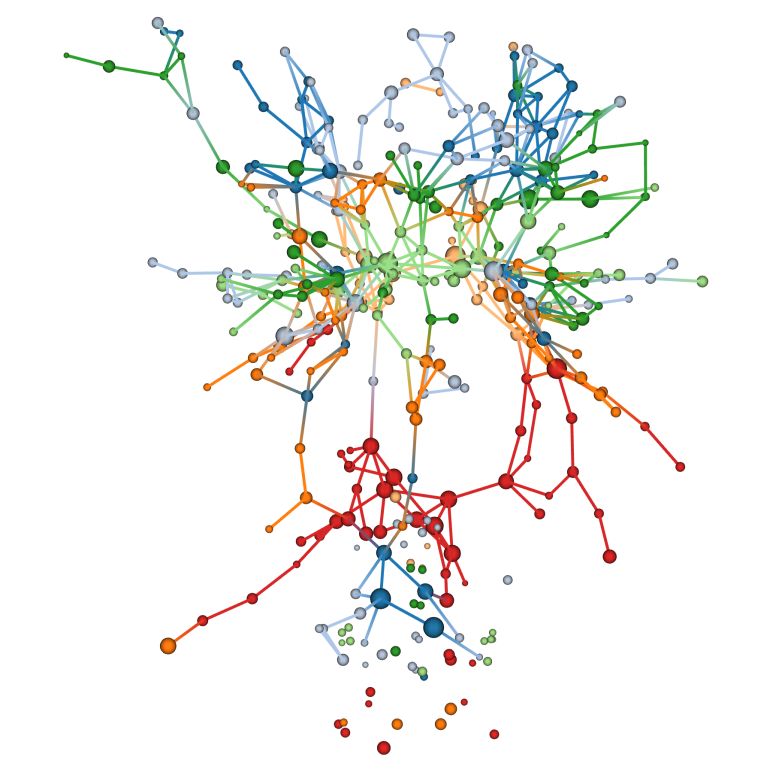
cola
Produces the most attractive layout for most graphs.
The CoLa layout algorithm is implemented with WebCola, developed by Tim Dwyer of the Monash Adaptive Visualisation Lab (MArVL).
cola-flow
A variation on the CoLa layout for directed graphs, which will arrange nodes so that edges run generally downward.
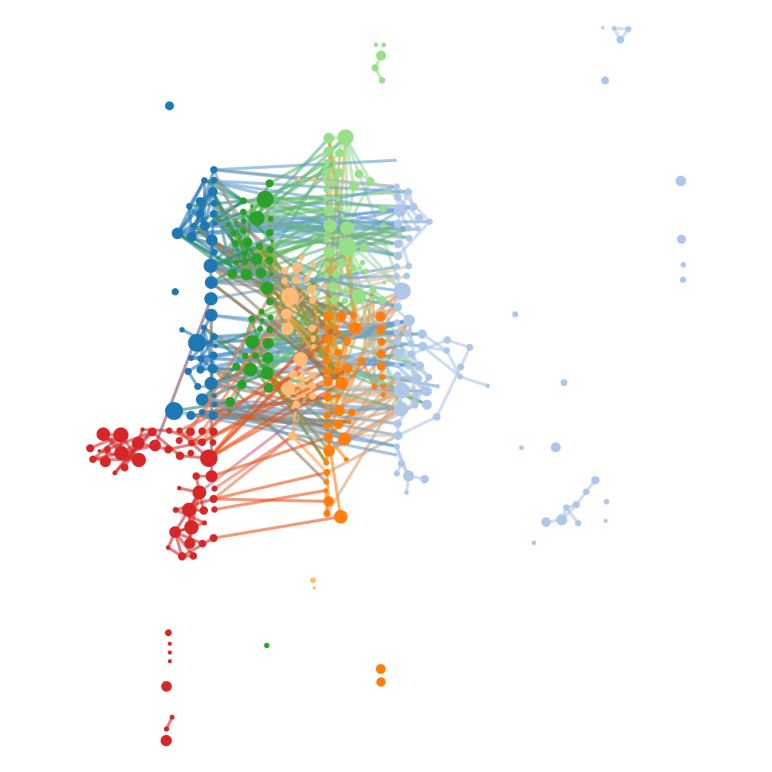
cose
The COSE (Compound Spring Embedder) layout algortithm is a physics-based method that produces fast results for large, complex graphs.
cose-bilkent
A variation on the cose layout developed by the i-Vis group of Bilkent University. It aims for a good balance between looks and speed
grid
Simple gridwise positioning with no meaningful edge handling. This will provide the fastest possible result, but will have limited utility for complex graphs.
concentric
Simple positioning into concentric circles. It has similar performance and drawbacks to the grid layout.
Bundle
The bundling option is handled differently by each layout option, but generally attempts to group nodes of the same value for the given attribute.
Controls
Use shift + click or shift + drag to select multiple nodes, which can then be moved together.
Nodes that have been bundled together can be moved as a group by hovering with their area until a box around the group is visible, then dragging.